Discover how the time-weighted rate of return calculates portfolio investment performance. Understand TWR, cash flow impact, and the true rate of return of an investment portfolio, your money and investment return.
Last Updated: March 06, 2026
This article is reviewed annually to reflect the latest market regulations and trends
TL;DR/Higlights
The TradingCup platform uses TWR to ensure that the leaderboard remains a transparent and accurate reflection of real trading skill. Here is the breakdown:
- True Performance Tracking: TWR measures how well a strategy performs by separating trading results from deposits and withdrawals. This ensures the rate of return reflects actual skill rather than changes in account size.
- The “Sub-Period” Method: Whenever funds move in or out, the system breaks the trading history into smaller intervals. These individual sub-period returns are then linked together to show the compound rate of growth over time.
- Why It Matters for You: This method allows you to see how the best traders are ranked by focusing purely on their strategy’s efficiency.
- Confidence in Copying: By removing the “noise” of cash flows, TWR helps you understand how the guide to copy trading workswith full confidence in the displayed numbers.
- Smarter Strategy Reviews: Whether you are looking at a highest win rate strategy review or a long-term performer, TWR provides the “true” rate of return generated by the signal provider.
Disclaimer: The information in this article is for educational purposes only and does not constitute financial, investment, or trading advice. Copy trading carries substantial risks, including the potential loss of your entire invested capital. Past performance of copied traders or strategies is not a reliable indicator of future results. You may be replicating high-risk trades, overleveraged positions, or strategies incompatible with your financial goals. Always conduct independent research into a trader’s historical performance, risk metrics, and strategy before copying them. Never invest funds you cannot afford to lose. Consult a licensed financial advisor to ensure copy trading aligns with your risk tolerance, financial objectives, and regulatory requirements in your jurisdiction. This article does not endorse specific traders, platforms, or strategies, and all trading decisions remain your sole responsibility.
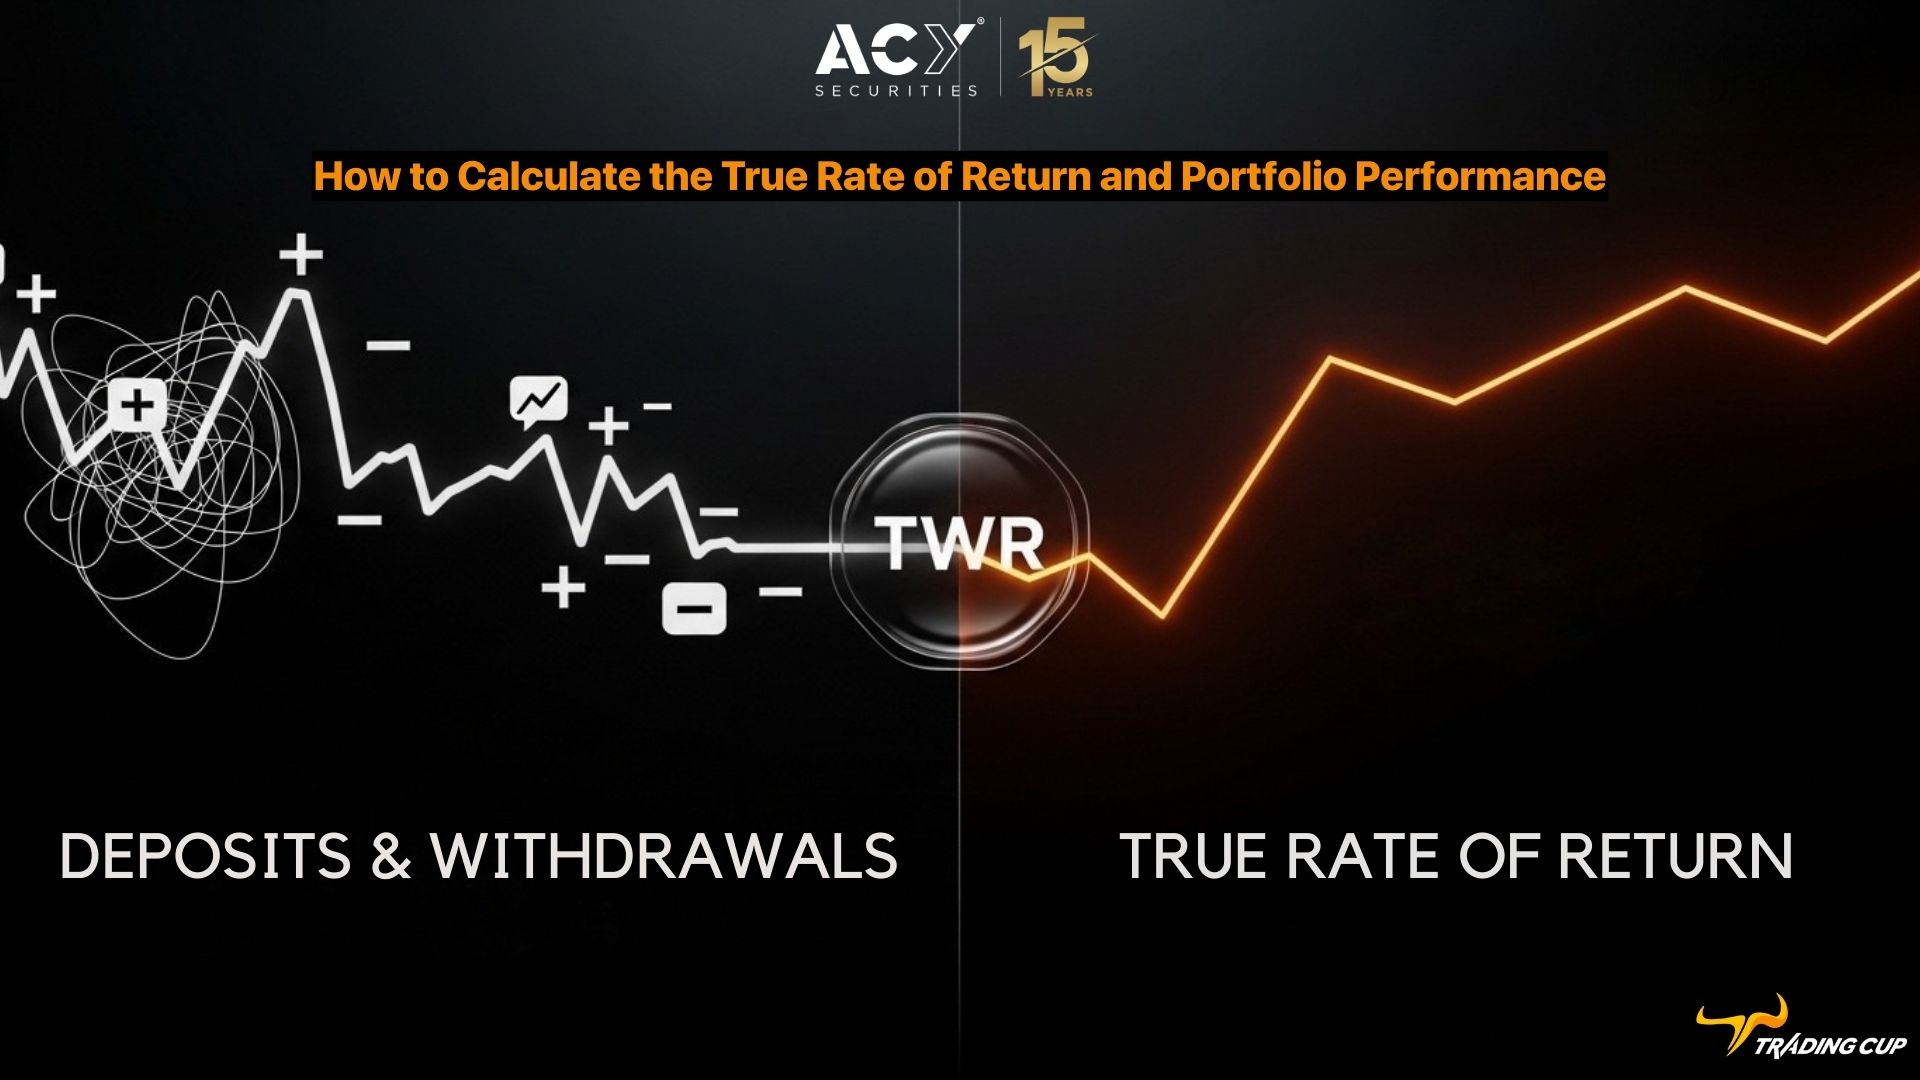
Time Weighted Return (TWR): How to Calculate the True Rate of Return and Portfolio Performance
Understanding performance in copy trading starts with one simple question: how does the time-weighted return measure the real return of a trading strategy?
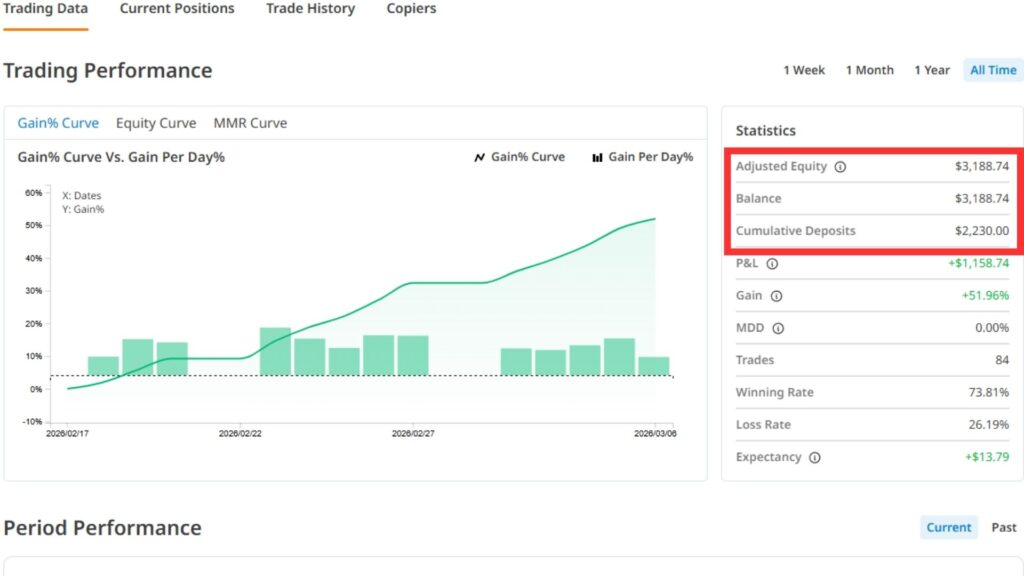
On the TradingCup platform, signal providers are ranked based on the portfolio performance of their strategies, and their rate of return updates hourly.
This means the return you see on the leaderboard must reflect actual trading results, not changes in deposits or withdrawals.
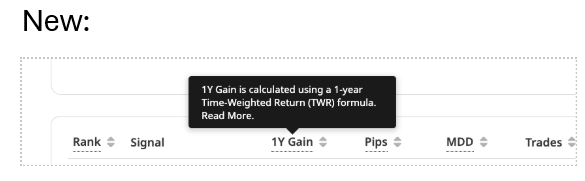
To deliver this level of transparency, we use a professional method called the time-weighted return, also known as the time-weighted rate of return (TWR).
What Is the Time Weighted Rate of Return?
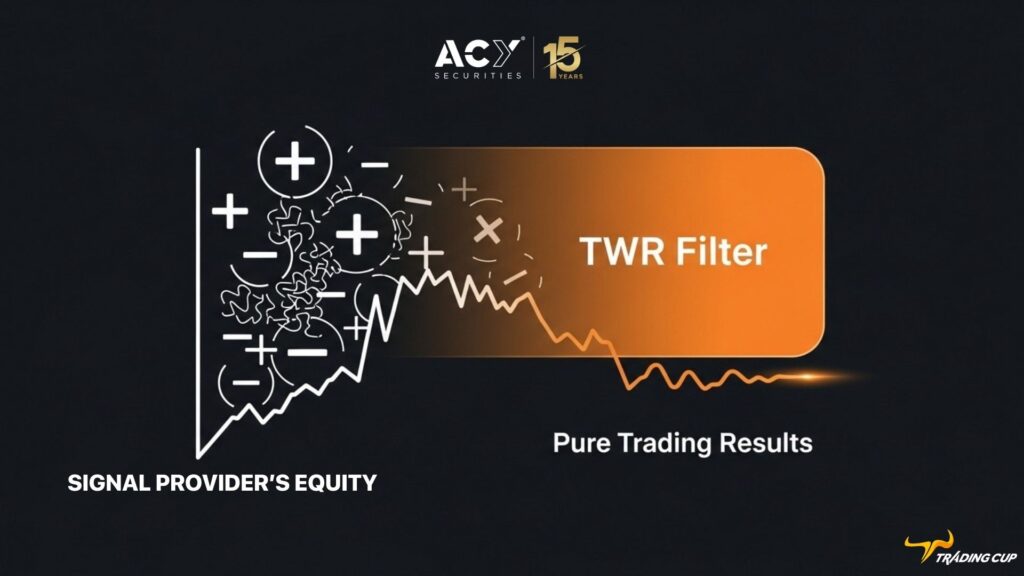
This calculation method measures how well a strategy performs over time by separating trading results from deposits and withdrawals.
When traders add or remove funds, those changes should not distort the rate of return shown on the leaderboard.
Instead of mixing capital changes with trading performance, the platform breaks results into separate time-weighted periods and measures the return of each period.
This approach allows the system to calculate the return based purely on trading results.
In professional portfolio reporting, the TWR of return is widely used because it focuses on the portfolio performance generated by the strategy itself.
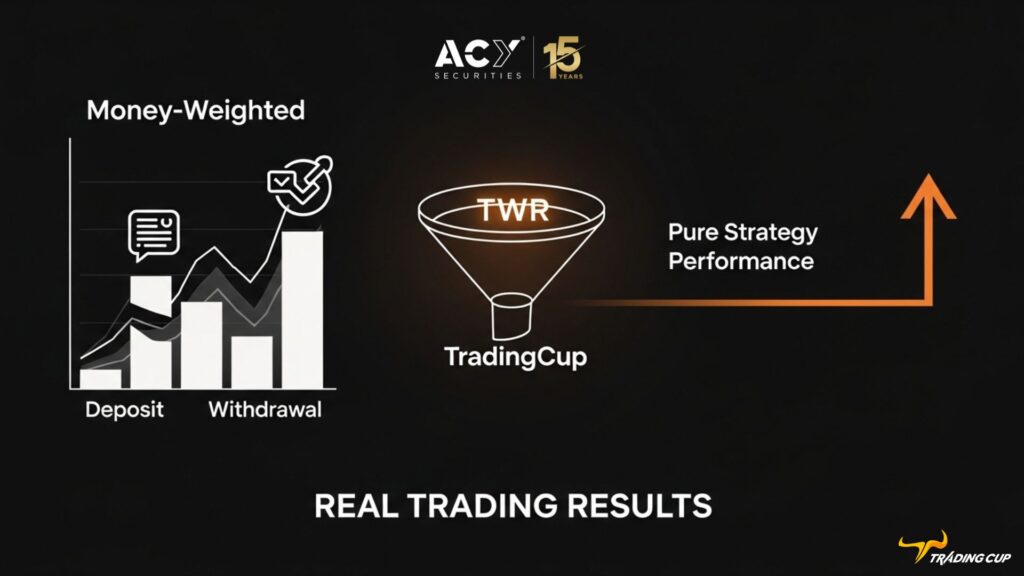
Time-Weighted Rate of Return vs Money-Weighted Return
A money weighted calculation takes into account when money enters or leaves the portfolio, meaning the timing of deposits can influence the rate of return.
In some situations, this can distort the true portfolio performance.
For example, if a signal provider adds funds to their portfolio, a simple money-weighted return could suddenly look smaller even though the strategy continued to perform well.
This is why many investment managers prefer to use these calculations when reporting the performance of an investment portfolio.
The TWR of return keeps the focus on trading results instead of the size or timing of deposits.
How Platforms Calculate the Time-Weighted Return (TWR)
To calculate this rate of return, the trading history is divided into smaller time periods whenever a deposit or withdrawal occurs.
Each of these becomes a sub-period used when calculating TWR. The system measures the rate of return for each sub-period, then links those weighted returns together to produce the final TWR.
The formula for calculating the time-weighted performance compares the starting value of the portfolio with the ending value during each time-weighted period.
Once the system finishes calculating the TWR, it combines those results to show the total portfolio return.
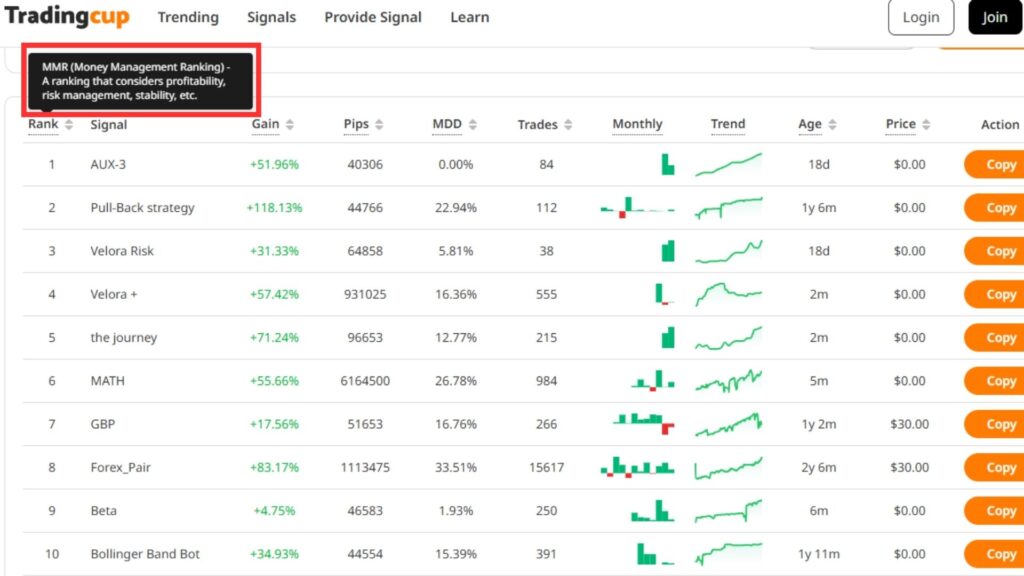
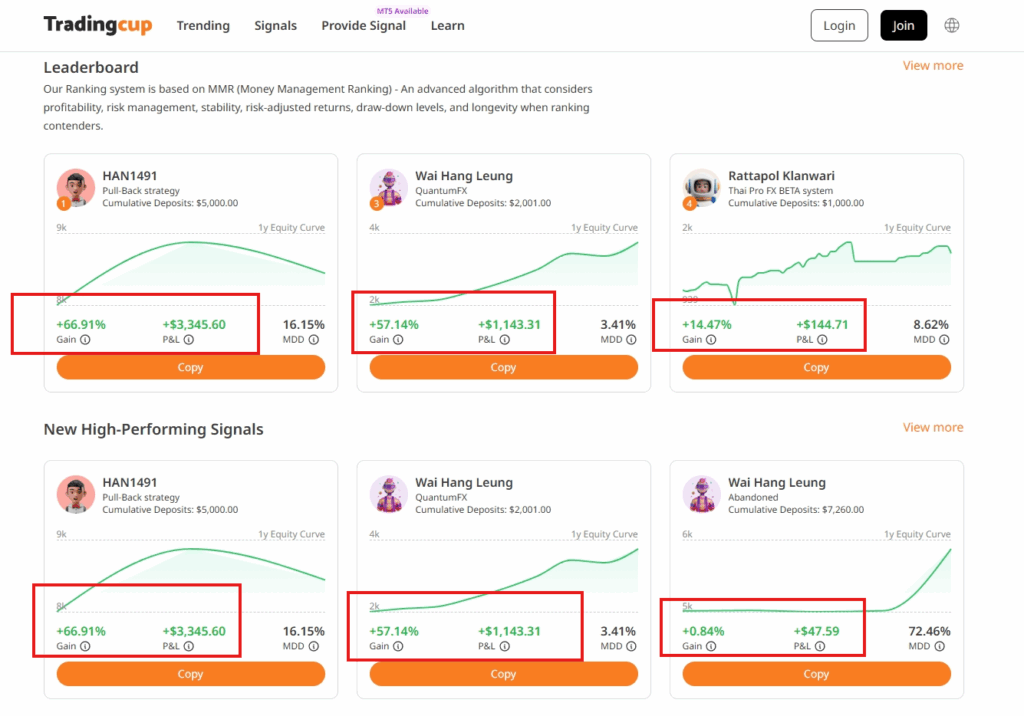
For traders reviewing the Top 20 leaderboard on the TradingCup signals page, this creates stronger transparency.
The time-weighted rate of return ensures the return of the portfolio reflects true trading performance rather than changes in cash flow.
This helps copiers evaluate strategies with confidence, knowing the rate of return represents the real performance generated by the signal provider.
The Formula Behind Portfolio Performance and Calculating TWR
To do this, the system breaks the trading history into smaller time intervals, often called sub-periods. Each time funds move in or out of the account, a new set of sub-periods begins.
The platform then calculates the period return for each section. These sub-period returns are linked together to measure the overall return of the strategy.
This method is known as the true time-weighted return method, and it helps traders see the real investment return created by trading activity.
When platforms use TWR, they measure the compound rate of growth produced by the strategy.
This means the system measures the compound rate at which the portfolio value grows over time.
This creates a clearer picture of the overall signal provider performance.
The key idea is simple. Time-weighted return calculates performance based only on trading results. Deposits and withdrawals are treated separately so they do not distort the numbers.
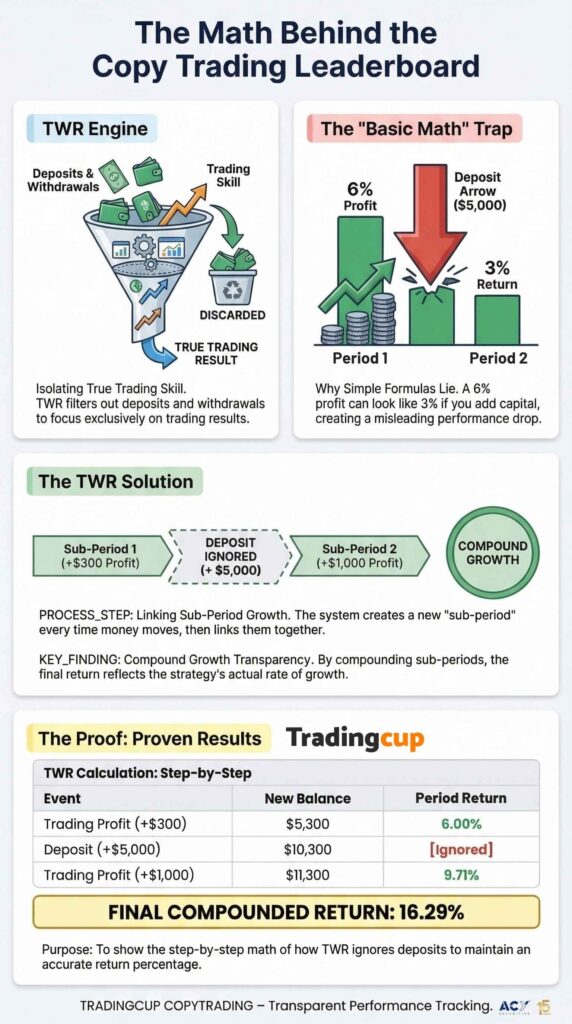
Example 1: How Deposits Affect Return Calculations
Let’s walk through a simple example to understand the time-weighted return vs a basic calculation.
Imagine a signal provider starts with an initial investment of $5,000.
During the first investment period, the strategy generates an investment return of $300.
The portfolio value becomes:
$5,300
The period return is:
6%
Now the trader decides to add $5,000 more to the account.
This is where the difference between the time-weighted return vs the money-weighted rate of return becomes important.
If we used a simple formula to calculate the return, the new portfolio value would be $10,300, and the system might say the return is also:
300 / 10000 = 3%
But this is misleading.
The strategy did not suddenly perform worse. The trader simply added more capital.
Using the true time-weighted return method, the platform treats the deposit as the start of a new investment period. The previous period return remains 6%, and a new sub-period begins.
This approach helps break down the return so the actual return from trading remains clear.
Example 2: How TWR Tracks Ongoing Strategy Performance
Now let’s continue the example.
After the deposit, the total balance is $10,300.
During the next investment period, the strategy generates another investment return of $1,000.
The account grows to:
$11,300
To calculate the time weighted return, the platform looks at the sub period returns rather than the total deposit.
The return for this second phase is:
9.71%
When the platform calculates the return across the two time intervals, it links the periods together to determine the total return.
This process measures the compound growth rate of the strategy.
The final overall return becomes:
16.29%
This shows the real investment performance of the signal provider.
| Step | Account Value Before | Event | Account Value After | Phase Return |
| 1 | $5,000 | Initial investment | $5,000 | — |
| 2 | $5,000 | Trading profit +$300 | $5,300 | 6.00% |
| 3 | $5,300 | Deposit +$5,000 | $10,300 | Deposit ignored |
| 4 | $10,300 | Trading profit +$1,000 | $11,300 | 9.71% |
Even though the trader added $5,000 more capital, the time-weighted return still measures the real performance created by the signal providers trading strategy.
Without this method, the return might appear smaller simply because more money was added to the portfolio.
By using the TWR, TradingCup can show the true investment return of each signal provider. This creates better transparency when traders review strategies on the Top 20 leaderboard.
Copiers can focus on what really matters:
- the skill of the strategy
- the historical performance of the investment
- the true rate of return generated over time
Why This Matters for Copy Traders
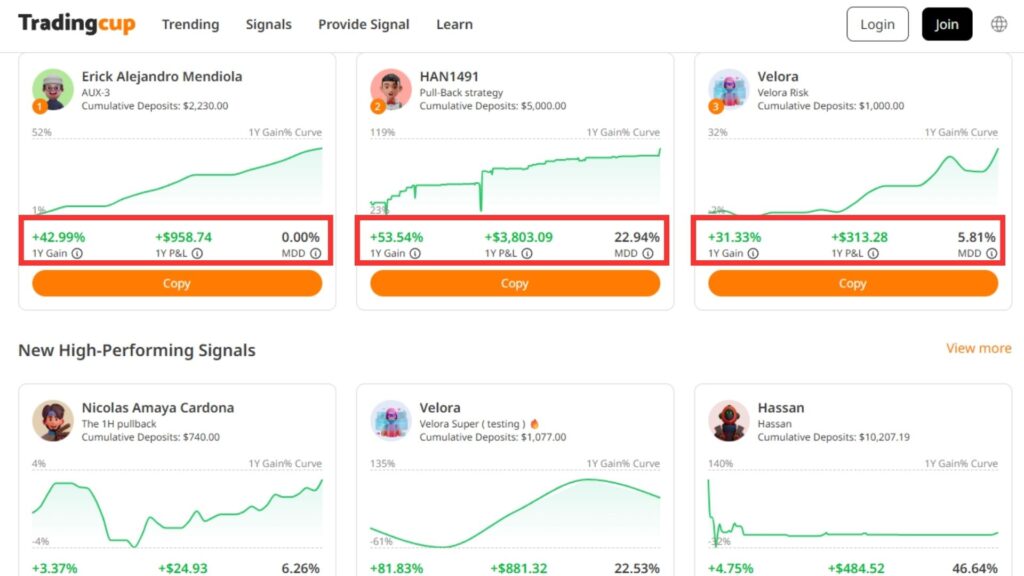
When traders look at the Top 20 leaderboard on TradingCup, they are essentially evaluating portfolio results to decide which strategy to copy.
The time-weighted return is a measure that helps them do this fairly.
Because the time-weighted average removes the impact of deposits and withdrawals, the performance of the investment manager becomes easier to judge.
The numbers reflect real trading results rather than changes in account size.
This means the portfolio which compensates for external cash flows can still show its real investment performance.
For example, if a strategy produces a negative return in one investment period but recovers later with a return of 10 percent, the system still measures the correct compound rate of growth over time.
This level of transparency is important for copiers reviewing the historical performance of an investment. It ensures that the return of the portfolio reflects trading skill rather than capital movements.
Why Professional Platforms Use Time-Weighted Returns
Many financial platforms need to calculate the return in a way that accurately reflects the performance of an investment portfolio.
If they rely on the money-weighted rate or money-weighted rate of return, deposits and withdrawals can distort results. In some cases, a strong strategy might appear weaker simply because more money was added to the account.
This is why many portfolio managers and investment funds prefer using the TWR. The time-weighted return focuses on trading results only, helping traders see the real portfolio performance over time.
Instead of mixing deposits with trading results, the platform calculates the return for each sub-period and links those sub-period returns together to determine the overall return.
Why Time-Weighted Return Works Better
Using the time-weighted rate of return (TWR) helps platforms measure performance more accurately:
- Separates trading results from deposits and withdrawals so the return calculation is not distorted.
- Measures true investment performance, focusing on the actual return generated by the strategy.
- Uses sub-period returns to track the portfolio value across different time intervals.
- Makes strategy comparisons fairer when traders review signals on the leaderboard.
For traders browsing the Top 20 leaderboard on TradingCup, this creates greater transparency. The time-weighted return shows the real rate of return based on trading results, helping copiers better understand the true performance of the portfolio over time.
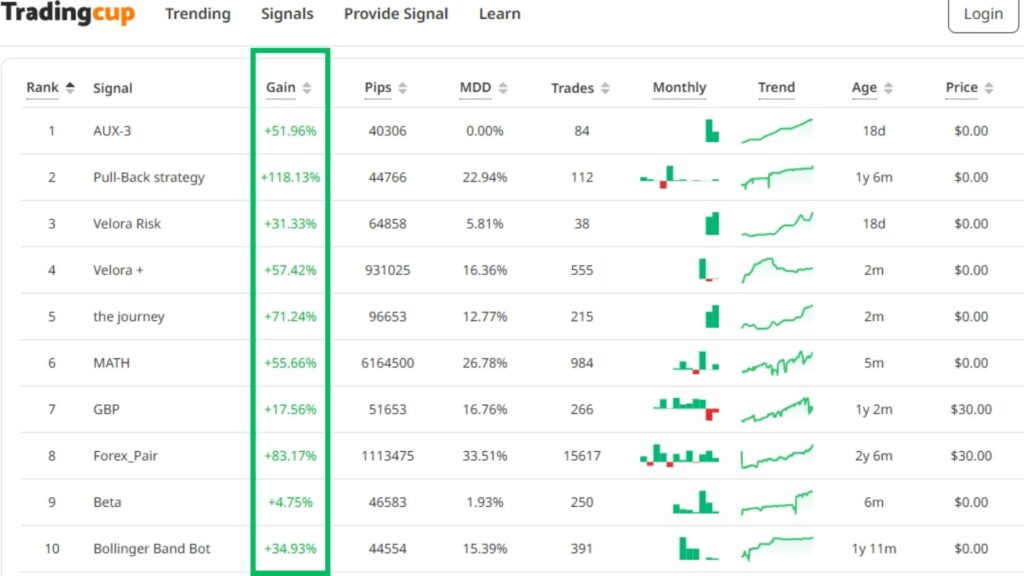
Looking for the Best Copy Trading Strategy?
We’ve compiled a leaderboard of the most outstanding traders with excellent drawdown control and clear trading styles. This way, you’ll never feel lost when choosing who to follow and won’t blindly chase trends. Click to view the latest trader rankings and find out who is truly worth copying! Choose the right person, copy the right strategy, and from today, let copy trading truly create value for you.
Bonus Guide
What Makes an Effective Investment Portfolio?
- Diversification: Spread funds across various asset types (e.g., stocks, bonds, real estate, cash, precious metals) and industries/regions to reduce exposure to single-market volatility.
- Asset Allocation: Tailor allocations based on your risk tolerance, goals, and time horizon. Conservative portfolios emphasize fixed income, while aggressive ones lean into equities.
- Risk-Reward Balance: Each asset has different risk/return profiles. Ensure your portfolio avoids excessive exposure to high-risk or low-return assets.
- Low Correlation: Combine assets with correlations below 0.3 to enhance stability and provide a cushioning effect during market swings.
- Dynamic Rebalancing: Review and adjust your portfolio regularly as markets or personal goals change to stay aligned with your risk-return expectations.
- Clear Objectives: Define your financial goals (retirement, housing, education) before designing your strategy and time horizon.
- Discipline & Logic: Stick to your investment plan without emotional decision-making. Regularly reassess assumptions and market conditions.
(Disclaimer: This article is for informational and educational purposes only. It should not be considered financial advice. Always conduct your own research and consult with a qualified financial advisor before making any investment decisions.
For more detailed insights on developing daily trading routines, risk management, and effective position sizing strategies, explore additional articles on Trading Cup. Our trading experts at ACY and FinLogix are also great resources to guide your journey towards trading excellence.

Discover Our Best Trading Signals
At Tradingcup, you can browse through a selection of signals and review past performance before you decide to copy.
Become A Signal Provider
Share your expertise and become a signal provider so other traders can copy your trades.
Stay tuned to our blog for more trader spotlights and leaderboard updates.
Trading involves risks.
Visit the Tradingcup blog through the link below for more updates: https://www.tradingcup.com/learn
Related Copy Trading blogs:
- Understanding Market Liquidations: Liquidity Sweeps and Runs Explained
- 7 Essential Daily Habits of Successful Traders to Outperform Their Peers
- 10 Strategies You Can Copy off Our Best Copy Traders
- 5 Strategies Every Trader Can Master To Trade Better In A Trading Contest
- 2025 Copy Trading Scams Exposed: How to Spot Fraud
- A Swing Trading Strategy with an 83 Percent Win Rate and Low Drawdowns
- Forex Martingale Strategies Explained, The Good, The Bad and The Ugly
- Pyramiding Trading Tutorial – Pros & Cons & How to Use It