
In the high-stakes world of trading, every move matters. Max Power, ranked 21st on the Tradingcup Leaderboard MMR, learned this the hard way after a costly misstep in the volatile gold market. Despite the setback, his impressive 87.72% win rate and strategic approach offer invaluable lessons for navigating bullish trends.
While Max didn’t break into the top 10, his journey highlights the importance of caution when trading trending assets like Gold, especially when using extreme leverage on a small account.
Ready to explore the highs, lows, and key takeaways from Max’s trading experience? Let’s dive in.
Trading Statistics
So far, Max has performed a total of 114 trades across 2 different instruments including:
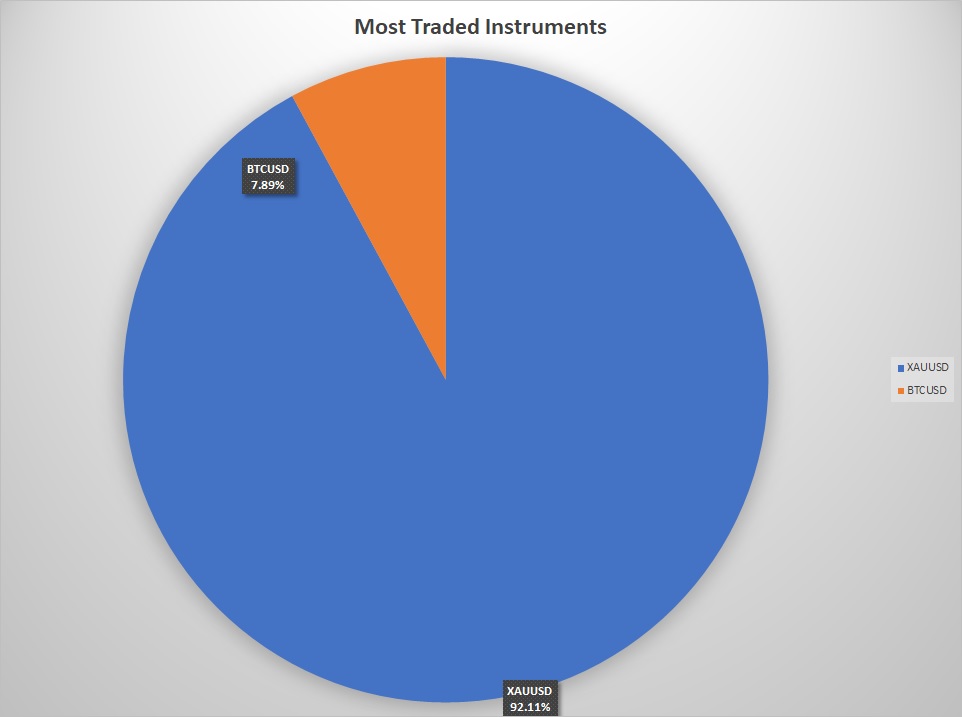
Total Trades: 114
Won trades: 100
Loss trades: 14
Break Even trades: n/a
Win rate: 87.72%
Average gain on wins: €15.54
Average loss on losses: -€59.69
Biggest Win: €67.21 (XAUUSD)
Biggest Loss: -€477.39 (XAUUSD)
Trade Direction: 76 Buys/Longs & 38 Sells/Shorts (66.67% of all his traders are Buys/Longs)
Best Performing Instrument: XAUUSD (€6.53 Total Gross/Unrealized PnL)
Worst Performing Instrument: BTCUSD (€3.59 Total Gross/Unrealized PnL)
Fastest Trade: 1 Minute (XAUUSD)
Longest Trade: Approximately 1 Day and 5 Hours (XAUUSD)
Average Trading Volume: 0.07 Lot Size
Smallest Trading Volume: 0.01 Lot Size
Largest Trading Volume: 0.24 Lot Size
Average Win to Loss PnL Ratio: 26% or 0.26:1 risk/reward ratio
Max has traded for approximately 45 days. He started trading on December 10, 2024, up to his most recent trade on January 24, 2025, with an average of 2.53 trades per day and an average holding time of 2.43 hours. He traded mostly on Gold during this period but preferred to trade both physical and digital gold with some Bitcoin trades he executed.
Accounting for his most recent trade, he has no active position at the moment:
His trading stats may change over time.
Key Highlights
Sharp Max Drawdown Correction
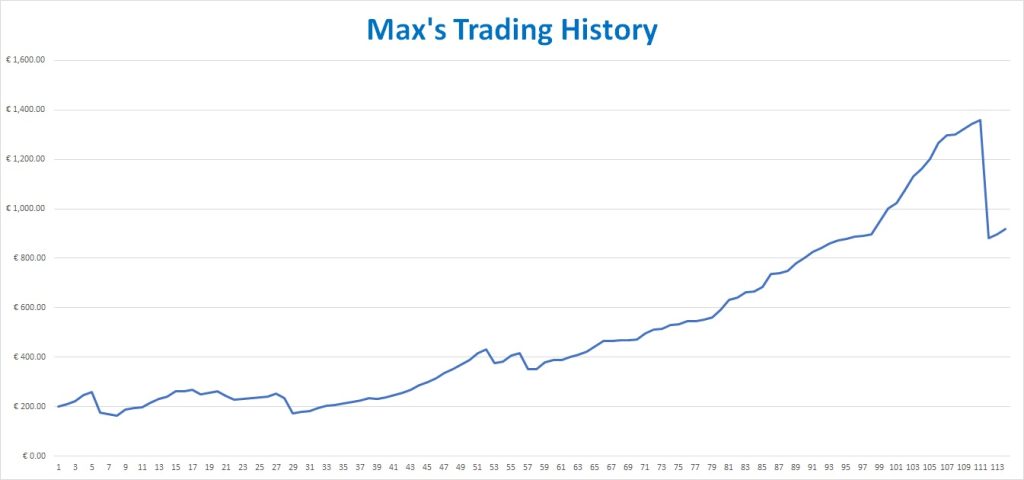
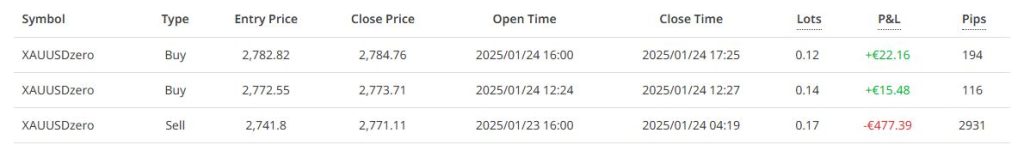
Max suffered the biggest blow on his trading portfolio during the sharp loss he had on his most recent Gold trade last January 24, 2025.
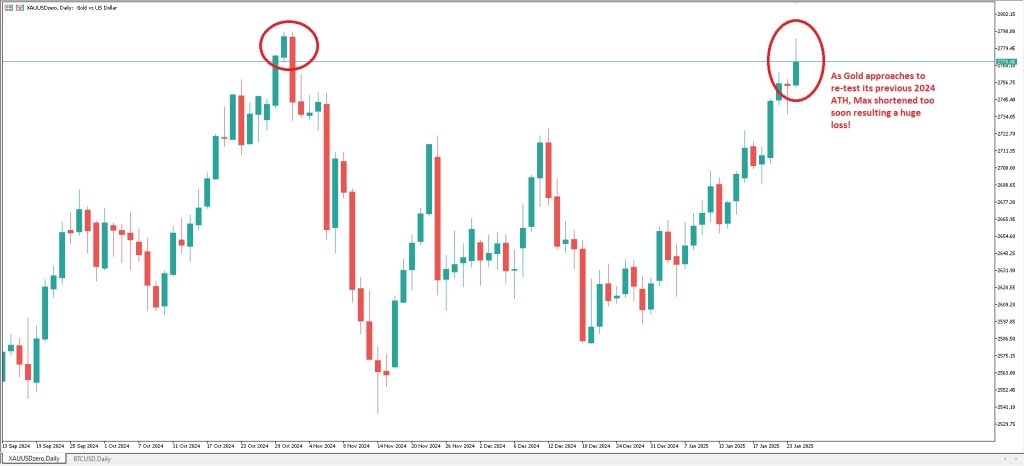
As Gold approaches to re-test its previous 2024 ATH, Max shortened too soon resulting in a huge loss!
Before this huge loss of -€ 477.39 (3rd to the last trade), Max had a decent 56.13% or 0.56:1 risk/reward ratio across his trades which helped his max drawdown curve all the way up.
This huge loss alone terribly corrected his portfolio’s gains for more than 41% max drawdown!
Theoretically, if he allowed his training system’s same level of stop loss tolerance on his second big loss at Gold trade #6 of -€ 82.60, he could have maintained the same max drawdown level up to date.
What can we learn from Max’s biggest loss?
Additionally, he had his system intact/in play until he suffered this loss in which he might have broken his trading rules/risk management with several factors like:
1. Emotional Influence
- Fear of Missing Out (FOMO): Seeing others profit from a trade can lead to impulsive decisions.
- Greed: Overconfidence after a winning streak may result in overleveraging or ignoring stop-losses.
- Fear: Panic during market volatility can cause traders to close positions prematurely.
2. Lack of Discipline
- Impatience: Waiting for the right setup can be challenging, leading to impulsive trades.
- Overtrading: Trying to compensate for losses or maximize gains can push traders to deviate from their plan.
- Ignoring the Plan: Some traders fail to adhere to their strategies due to a lack of commitment or trust in their rules.
3. Cognitive Biases
- Confirmation Bias: Traders might ignore signals that contradict their trade bias.
- Recency Bias: Overestimating the significance of recent market trends can lead to rule-breaking.
- Anchoring: Relying too heavily on initial data, even when new information emerges.
4. Market Conditions
- Unexpected Events: Sudden news or market movements can cause emotional reactions.
- High Volatility: Rapid price changes can tempt traders to abandon their strategies.
5. Inadequate Preparation
- Lack of Knowledge: Traders might not fully understand their strategies or the markets they trade in.
- Unrealistic Expectations: Setting unattainable goals can lead to frustration and impulsive decisions.
- Insufficient Risk Management Tools: Not using stop-losses or position-sizing correctly can increase emotional stress.
6. External Pressures
- Financial Stress: Trading with money one cannot afford to lose increases emotional decision-making.
- Peer Pressure: Comparing results with others can push traders to take unnecessary risks.
7. Fatigue and Overconfidence
- Mental Fatigue: Prolonged trading without breaks can impair decision-making.
- Overconfidence: Success in previous trades might lead to complacency or reckless behavior.
How to Stay on Track:
- Follow a Written Plan: Clearly define entry, exit, and risk management rules.
- Use Automation: Leverage tools like stop-loss orders to minimize emotional interference.
- Regularly Review Performance: Reflect on trades to identify and correct patterns of rule-breaking.
- Maintain Discipline: Take breaks, avoid overtrading, and stick to your plan.
Conclusion
Max’s biggest loss trade on Gold, as he tried to short XAUUSD but considering the trading account size margin and leverage he had, going back to the 1H chart, we can see that he shorted at the very support levels which is a very bullish hourly candle after failing to consider the newly established Gold hourly bullish FVG that sent price higher!
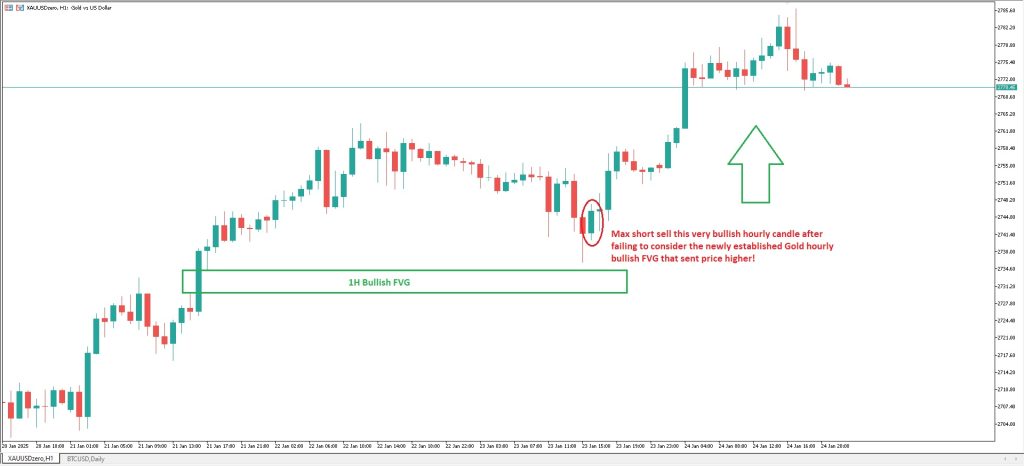
This move gave Max no reason to hold his short trade any longer which eventually triggered his stop loss resulting in the biggest loss of his portfolio.
Gold at this point in time is bullish and the fact that it is still hovering near its previous all-time high levels can be one of the proofs to support this bias.
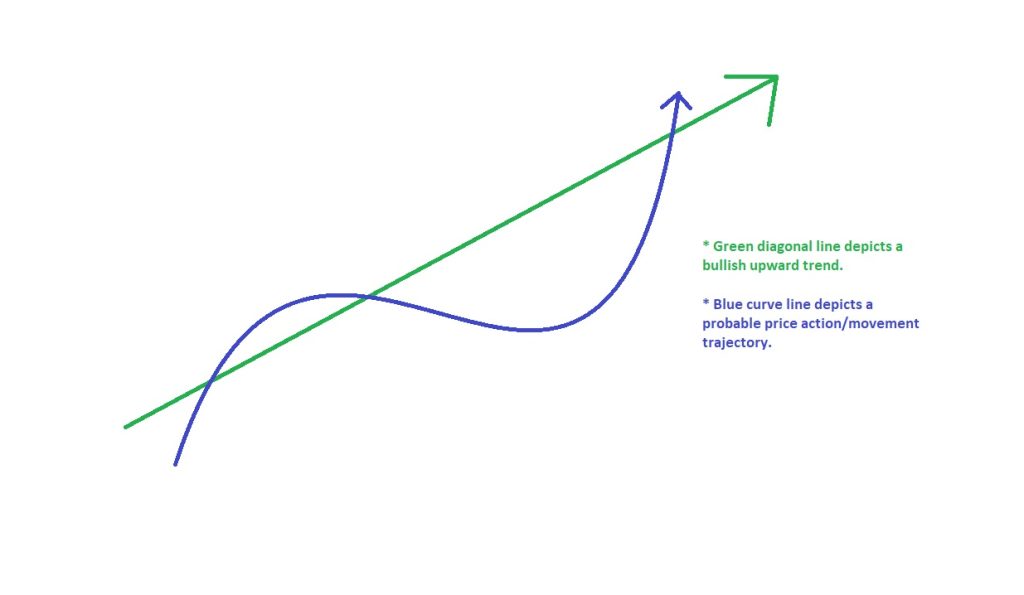
Fighting or trading against a bullish trend can be challenging, as the prevailing market sentiment and momentum favor upward price movement. However, with the right strategies and risk management, traders can identify opportunities to either counter the trend or join it at opportune moments.
Here’s what we can learn and where to consider a long position:
1. Understand the Risks of Fighting a Bullish Trend
- Momentum is Strong: Bullish trends are driven by consistent buying pressure, often supported by positive news or fundamentals.
- Counter-Trend Trades are Risky: Shorting in a bullish trend can lead to significant losses if the trend accelerates.
- Timing is Crucial: Entering too early against a bullish trend can be costly, as the trend may continue longer than expected.
Key Takeaway: Fighting a bullish trend requires precision, discipline, and strict risk management.
2. When to Consider Fighting a Bullish Trend
- Overbought Conditions: Use technical indicators like RSI, Stochastic Oscillator, or Bollinger Bands to identify overextended markets.
- Divergence Signals: Look for a bearish divergence between price and momentum indicators, signaling a potential weakening of the trend.
- Key Resistance Levels: Identify historical resistance zones where the price might struggle to break higher.
- Volume Anomalies: A decrease in volume during upward moves can indicate weakening buying interest.
Example: If RSI exceeds 70 and shows divergence with price, it may signal a potential reversal.
3. Where to Consider a Long Position in a Bullish Trend
- Pullbacks to Support Levels: Enter on retracements to significant support zones, such as:
- Fibonacci Levels: 38.2%, 50%, or 61.8% retracements are often reliable entry points.
- Moving Averages: Dynamic supports like the 20-day or 50-day EMA can act as bounce zones.
- Trendlines: Established upward trendlines provide clear areas to buy during pullbacks.
- Breakouts Above Consolidation: When the price consolidates in a range and breaks upward, it signals a continuation of the bullish trend.
- Volume Confirmation: Ensure that buying volume increases during pullbacks or breakouts to validate the move.
Example: If the price retraces to the 50-day EMA with increasing volume, it could be a strong long entry point.
4. Strategies to Navigate a Bullish Trend
Trend-Following Strategy:
- Use moving averages or Ichimoku Cloud to confirm the trend direction.
- Enter on pullbacks or breakouts in the direction of the trend.
Contrarian Strategy (Fighting the Trend):
- Use tight stop-losses to minimize risk.
- Target short-term profits during overbought conditions or at key resistance levels.
Risk Management:
- Assure that each trade represents no more than 1-2% of your total funds.
- Implement stop-loss strategies to shield yourself from unfavorable market shifts.
5. Psychological Considerations
- Patience is Key: Wait for the price to reach favorable zones before entering a trade.
- Avoid Impulse Trading: Do not enter positions based solely on fear of missing out (FOMO).
- Stay Flexible: Be ready to switch strategies if the market invalidates your initial analysis.
Fighting a bullish trend can offer short-term opportunities, but the safer and more profitable approach is often to align with the trend.
Look for pullbacks to key support levels or breakouts with volume confirmation to enter long positions. Keep risk mitigation at the forefront of your trading philosophy and consistently adhere to a structured, disciplined method.
Although Max has suffered this costly loss, his trading stats are still having more room for adjustments, no doubt he will make a great comeback run as he won 2 trades afterward and still sits in a pretty 359.02% gain.
Wishing good luck to Max as he continues his trading recovery and works his way up to the Tradingcup leaderboard ladder.
You can subscribe to his trading signals by clicking the copy button on his profile:

You can also check his profile for more trading statistics through the link below:
https://www.tradingcup.com/signals/610040252?server=6&login=610040252
Are you a skilled and talented trader or a fund manager looking to join the ongoing leaderboard competition, and provide or copy trading signals?
Join by visiting the Tradingcup website now.
Discover Profitable Signals
At Tradingcup, you can browse through a selection of signals and review past performance before you decide to copy.
Become A Signal Provider
Share your expertise and become a signal provider so other traders can copy your trades.
Stay tuned to our blog for more trader spotlights and leaderboard updates.
Trading involves risks.
Visit the Tradingcup blog through the link below for more updates: