
Last Updated: July 16, 2026
This article is reviewed annually to reflect the latest market regulations and trends.

EMAs + Fractals Strategy Breakdown
Despite having nearly four years of trading history, the EMAs with fractals strategy experienced intermittent pauses due to capital withdrawals and inactivity, only resuming operations this year. From January to March, its performance remained modest. However, since April, amid heightened market volatility triggered by a new round of tariff threats from Donald Trump, the strategy has demonstrated strong resilience—delivering consistent gains and a steadily rising equity curve.
Performance Breakdown: 96% Win Rate vs. 39% Max Drawdown
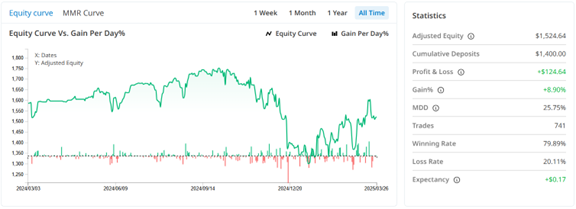
Since the beginning of the year, the strategy has maintained a high win rate of 96%, reflecting strong signal accuracy. However, this success has been accompanied by relatively significant drawdowns, peaking at 39%, suggesting room for improvement in managing unrealized losses. Narrowing the observation window to the past month reveals a more stable profile: the win rate remains above 95%, with a monthly return of 16%, while the maximum drawdown has dropped sharply to 22%. This may indicate either an optimization in entry precision or risk management, though further observation is needed to confirm whether it’s due to structural improvement or favorable market conditions.
| Year-to-Date | Past Month | |
| Win Rate | 96.08% | 98.84% |
| Max Drawdown | 39.31% | 22.26% |
| Return | 16.33% | 16.62% |
Optimizing Entries: Lessons from EUR/USD and USD/JPY Trades
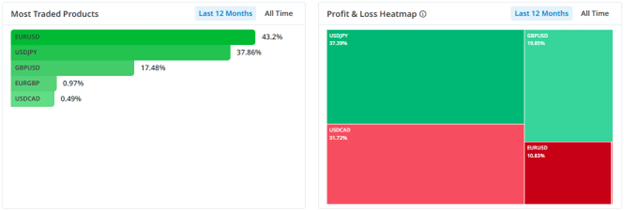
The strategy focuses primarily on two major forex pairs—EUR/USD and USD/JPY—with the latter serving as the main source of profit. Each trade has an average holding time of less than 5 hours, in line with the strategy’s scalping nature. Position size is strictly controlled at 0.01 lots per trade, ensuring that risk remains manageable even in volatile conditions.
How the EMAs + Fractals Strategy Works: Precision in Volatile Markets
The system integrates four Exponential Moving Averages (EMAs) with the Fractals indicator to identify potential support and resistance zones for entries and exits.
Understanding Fractals: Key to Support & Resistance Zones
Fractals are five-candle patterns used to pinpoint localized highs and lows:
- Bearish Fractal: The middle candle is the highest, flanked by two lower candles on each side.
➤ Typically appears at local resistance zones, signaling potential reversals downward. - Bullish Fractal: The middle candle is the lowest, with two higher candles on each side.
➤ Often appears at support zones, indicating possible reversals upward.
When combined with EMA-based trend direction, fractals enhance entry precision and support more effective risk control.
(Credit:Julie Bang © Investopedia 2020)
Risk Management in Scalping: Why 0.01 Lot Size Matters
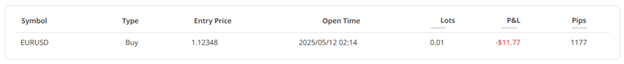
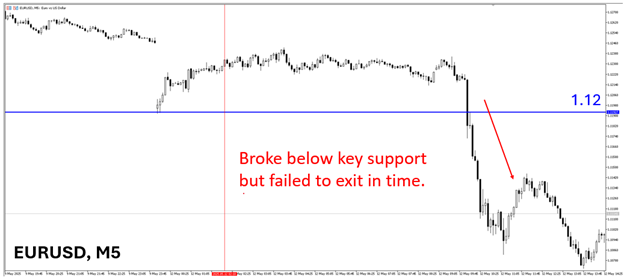
While performance has improved, prospective copy traders should remain cautious regarding the system’s stop-loss execution. Observations show that the strategy does not always cut losses promptly when prices breach critical support.
For example, a long signal on EUR/USD issued on May 12 was triggered when the euro briefly found support around 1.12 after a gap-down open. However, as prices continued to fall below this key level, the trade remained open through May 13, accumulating losses without triggering an exit.
That said, the consistent use of 0.01 lot position size means that even when stop-losses are delayed, losses remain within a controlled range. Therefore, those considering this strategy are advised to ensure their account balance can absorb short-term drawdowns and adjust position size based on individual risk tolerance.
For those studying this approach or looking to build a similar strategy, it’s worth considering how a trailing stop loss might affect performance. With an average win of just $0.39 per trade as of May, introducing a trailing stop on some positions could help capture larger profits when the market moves favorably. However, this would likely reduce the overall win rate, as more trades might be stopped out prematurely. It’s an important trade-off to keep in mind when evaluating or adapting this type of high win-rate strategy.
For more detailed insights on developing daily trading routines, risk management, and effective position sizing strategies, explore additional articles on Trading Cup. Our trading experts at ACY and FinLogix are also great resources to guide your journey towards trading excellence.

Discover Our Best Trading Signals
At Tradingcup, you can browse through a selection of signals and review past performance before you decide to copy.
Become A Signal Provider
Share your expertise and become a signal provider so other traders can copy your trades.
Stay tuned to our blog for more trader spotlights and leaderboard updates.
Trading involves risks.
Visit the Tradingcup blog through the link below for more updates: https://www.tradingcup.com/learn
Related Copy Trading blogs:
- Understanding Market Liquidations: Liquidity Sweeps and Runs Explained
- 7 Essential Daily Habits of Successful Traders to Outperform Their Peers
- 10 Strategies You Can Copy off Our Best Copy Traders
- 5 Strategies Every Trader Can Master To Trade Better In A Trading Contest
- 2026 Copy Trading Scams Exposed: How to Spot Fraud
- A Swing Trading Strategy with an 83 Percent Win Rate and Low Drawdowns
- Forex Martingale Strategies Explained, The Good, The Bad and The Ugly
- Pyramiding Trading Tutorial – Pros & Cons & How to Use It