
In today’s blog, I’m going to talk about a certain Tradingcup’s participant who ranked 198 based on platform’s MMR system.
His name is Prawin and traded Gold only from June 29, 2023 to November 15, 2023. That’s approximately 139 days.
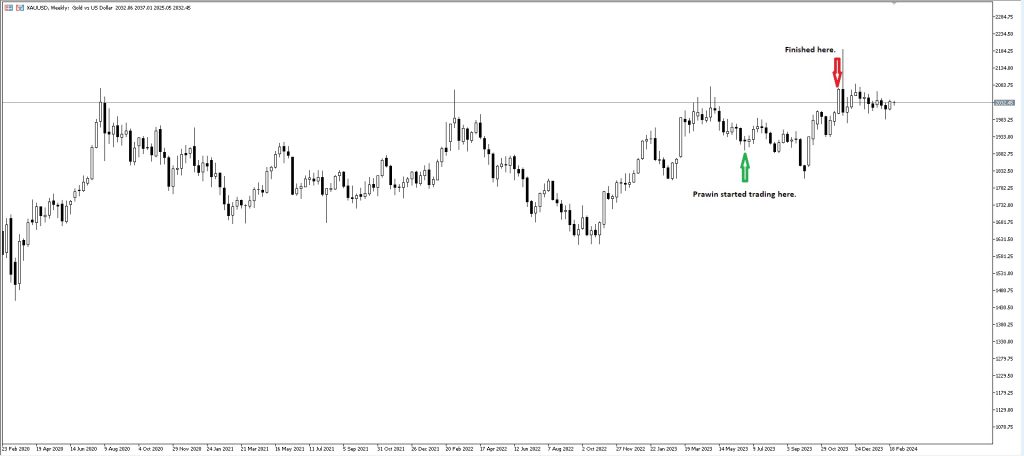
XAUUSD MT5 Weekly Chart
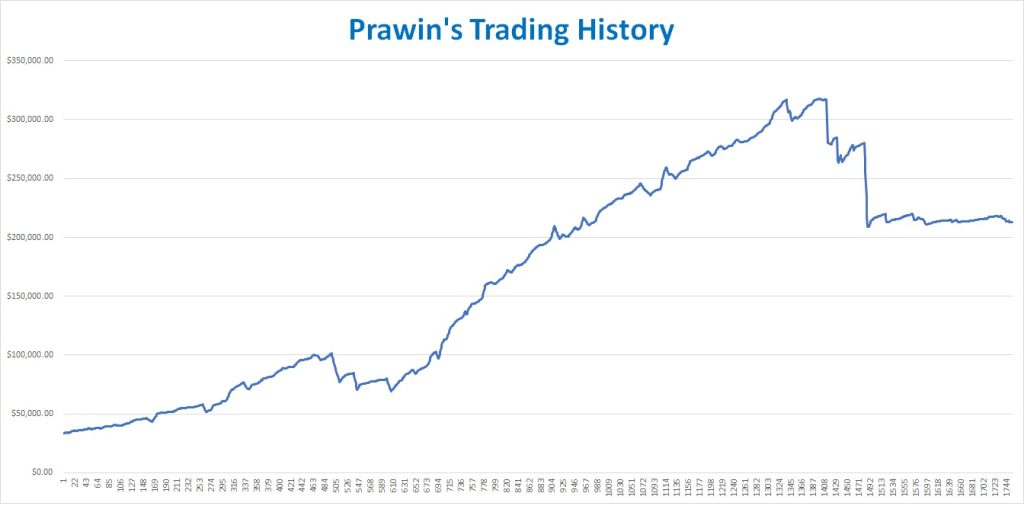
Within this period, he grew his portfolio to over 500% gains. Like Riadh Debbabi, he can be a rich entity with total deposits of $33,080.37 and ended his trading account’s balance to $192,685.26!
Despite ranking just within the top 200, Prawin will give us valuable and crucial trading lessons that can be applied for beginning and veteran traders alike which I will discuss more later.
In my previous blogs, I highlighted each featured trader’s strategy and performance but for this episode, I will talk seriously about specific trading aspects.
Trading Statistics
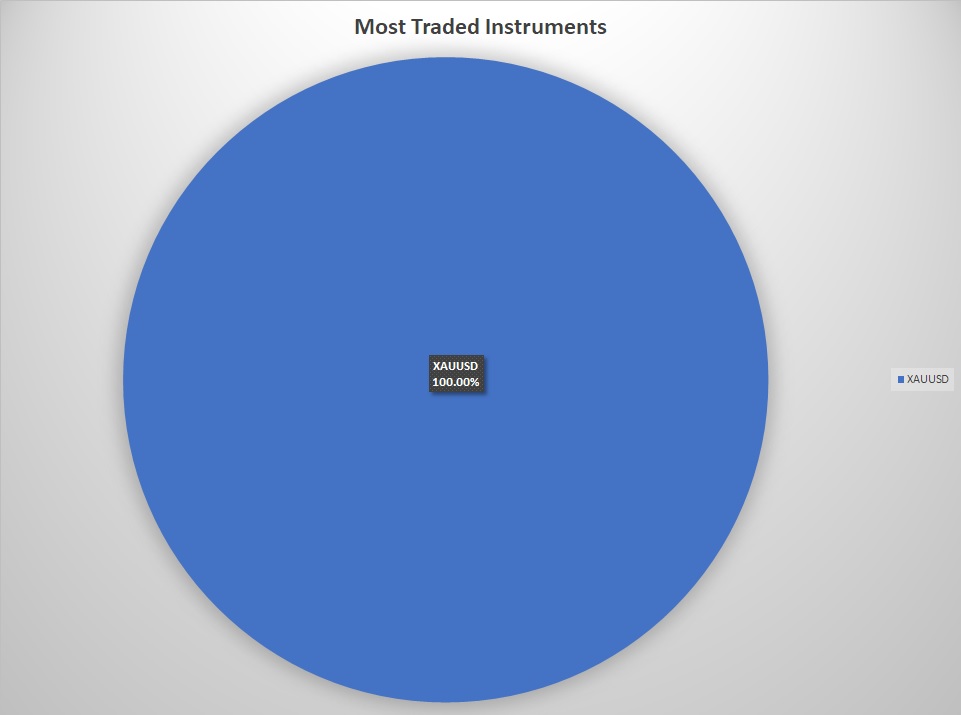
Prawin performed a total of 1755 trades on XAUUSD only:
Total Trades: 1755
Won trades: 1428
Loss trades: 327
Win rate: 81.37%
Average gain on wins: $357.54
Average loss on losses: -$1,011.32
Biggest Win: $2,496.42
Biggest Loss: -$19,042.00
Trade Direction: 865 Buys/Longs & 890 Sells/Shorts (50.71% of all his traders are Sells/Shorts)
Fastest Trade: Less than a minute
Longest Trade: Approximately 28 Days
Average Trading Volume: 1.30 Lot Size
Smallest Trading Volume: 0.01 Lot Size
Largest Trading Volume: 2.01 Lot Size
Drawdown Challenges
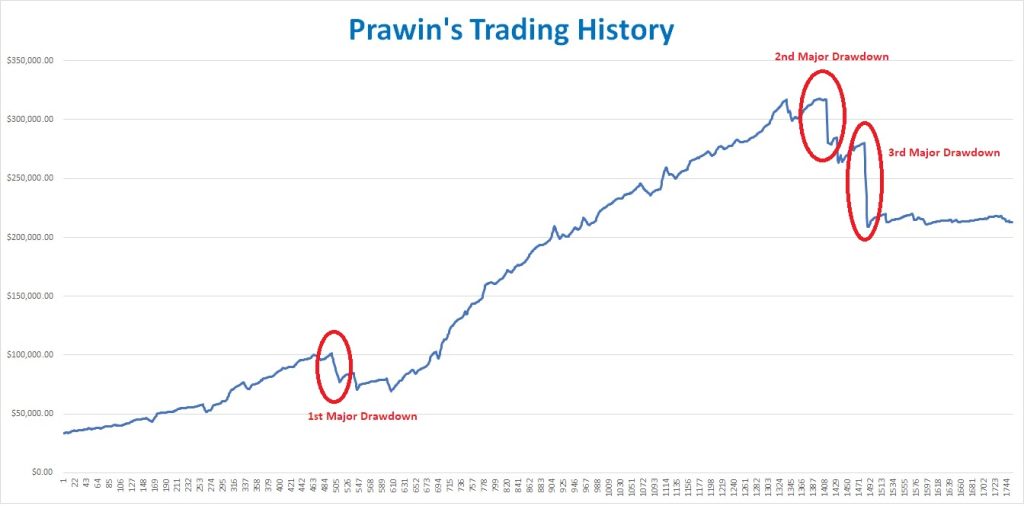
Let’s have a look at Prawin’s equity curve again.
Based on the chart above, he has experienced three major drawdowns particularly on his 499th, 1412th and 1482nd trades respectively totaling a 50.72% max drawdown in his portfolio.
Here are the breakdowns during each drawdown period:
First Major Drawdown
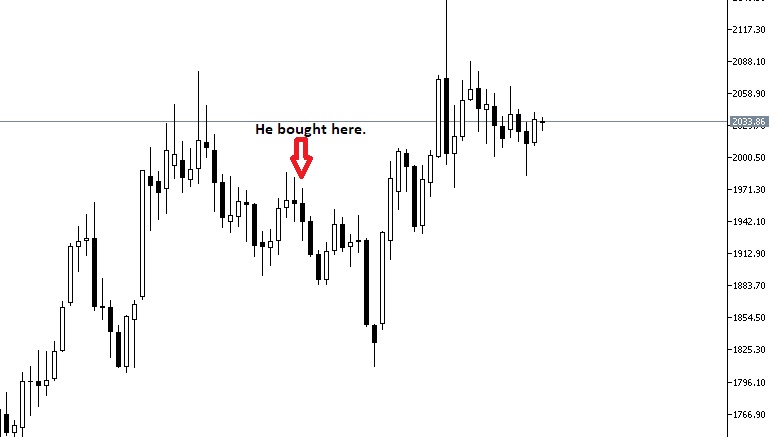
According to the Gold’s weekly chart above, he bought during that typical July weekly candle that marks the first major drawdown on his equity curve.
Here are the buy trades:
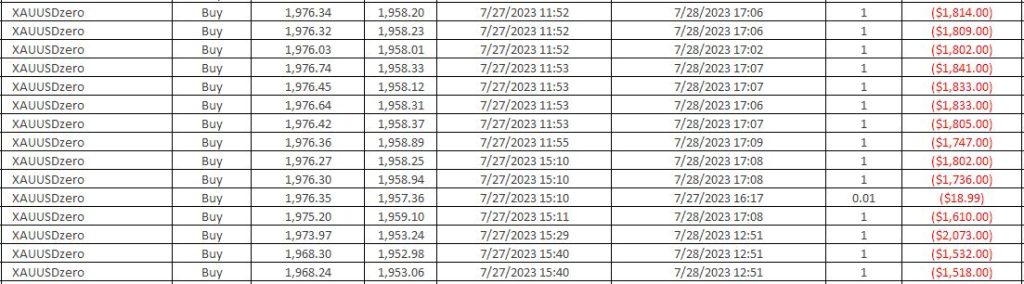
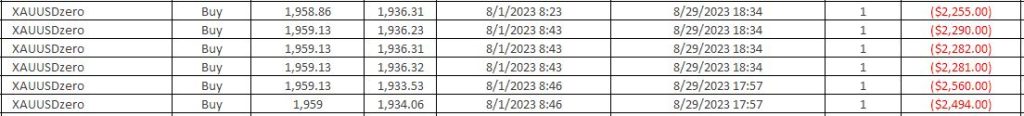
Second Major Drawdown
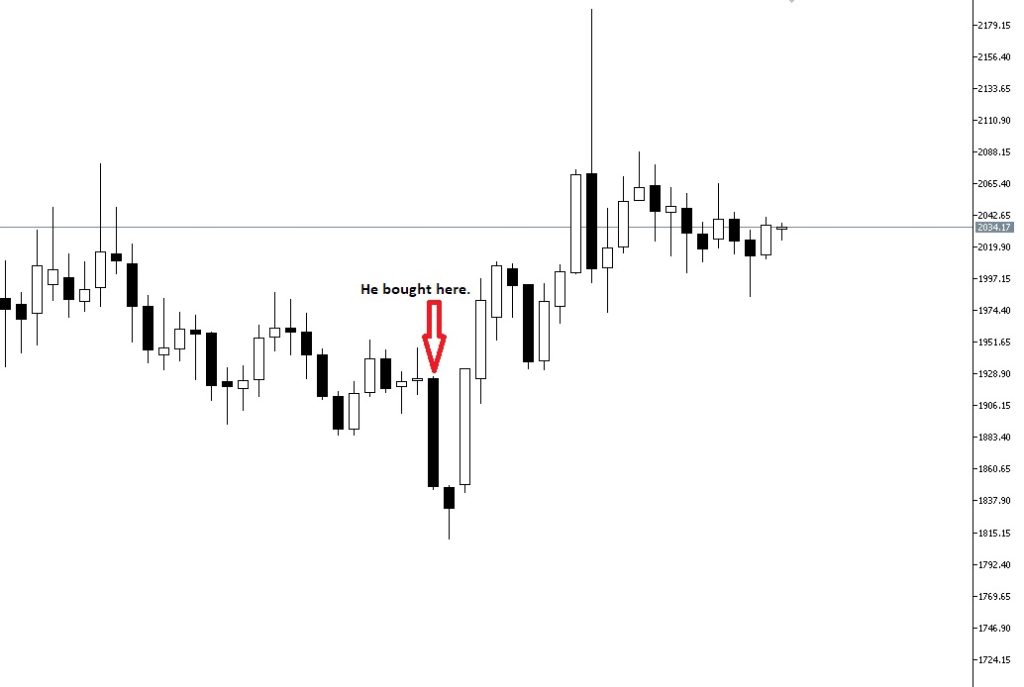
Prawin opened bad long positions that proceeded a full bodied bearish weekly candle that marks his second major drawdown.
Trades’ details:

The worst part is, he sold the positions (through triggering their stop losses) to the bottom that followed a weekly trend reversal.
Third Major Drawdown
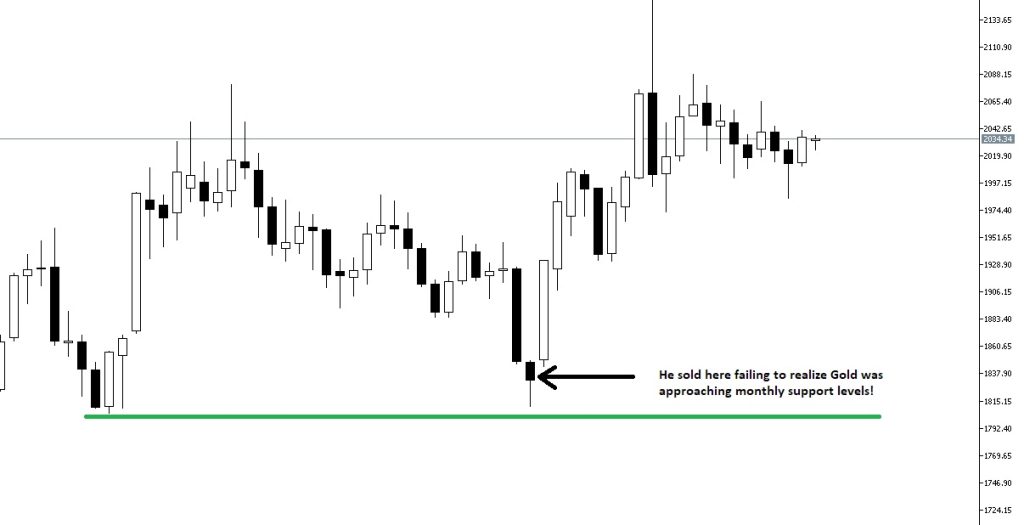
Prawin’s last major drawdown is the worst among the 3. Like I’ve said previously, trades made during this period were sold to the very long-term support levels of Gold!
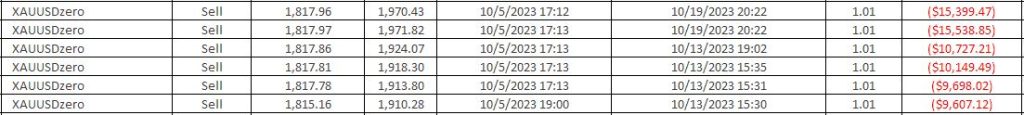
If he hold those positions in the 2nd and 3rd drawdown levels a bit longer they could have been closed in break-even levels at least avoiding unnecessary big losses.
He failed to realize that Gold was approaching strong support levels that could have saved his bad trades.
In my opinion, Prawin became emotional during these times and I cannot blame him for closing them in huge losses. He could have thought that there might be further dropping to break that support level down.
Here Are Things We Can Learn on Prawin
Advantages of Trading One Instrument Only
While Lin Yang diversified his portfolio by trading different market instruments, Prawn focused on trading one instrument only. This strategy allows traders to develop their skills in entering and exiting at high-probability times more efficiently than when trading multiple markets.
A more aggressive and riskier approach in comparison.
Prawin’s Weaknesses
Look at the trades above, he held these for 28 days! As a trader myself, I have experiences getting emotional by holding trades longer hoping for a recovery, turn-around, or back break-even levels but lose eventually.
No longer follows trading plan. Over trading, over risking, adjusting stop losses that initially planned. It is like a gambling already not a trading business!
He even turned greedy by trading large volume/position size. These are dangerous approaches and no disciplinary actions will ruin one’s portfolio in no time.
Bad Average Win to Loss PnL Ratio
Prawin has a huge gap between the average wins and losses, with a 35.35% Win to Loss PnL Ratio totally exceeded below the profitable 2:1 ratio which is 200%. Definitely not good for the long run!
Fighting Against a Market Trend
We keep hearing this, do not fight the market but instead ride it.
My own version quotes here:
“A trend is a friend until it becomes a fiend.”
Speaks true to the matter. Based on my continued observation on the markets, there are 2 sides of traders participating. First is the losing side, second the winning side.
Here are the weekly charts that depict Gold’s downtrend and uptrend during the period that Prawin participated and he paid the prices in full.
Gold Downtrend from April to October 2023
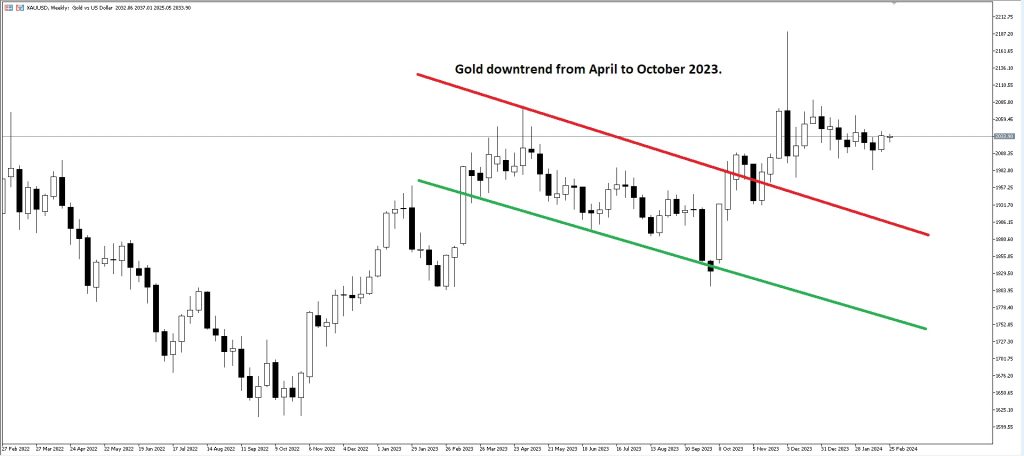
XAUUSD MT5 Weekly Chart
Gold Uptrend from October to December 2023
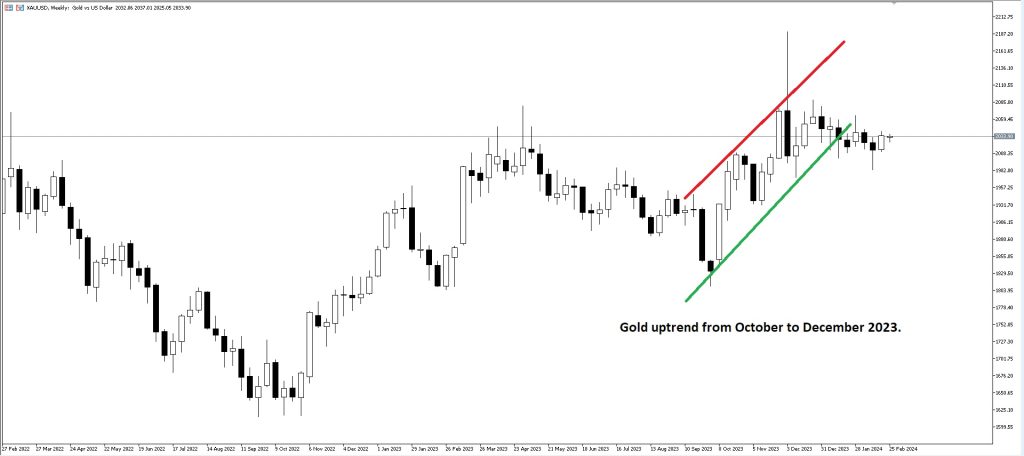
XAUUSD MT5 Weekly Chart
I don’t blame Prawin for not able to recognize the trends. Charts are easier to analyzed once they are done already. I really can tell during that time he traded with difficulty, trading live is hard than most people expected.
Based on his equity curve earlier, we can see he has 3 major drawdown levels with the explained trade executions he made on those periods clearly fighting the Gold downtrend and uptrend respectively.
His biggest losses were even traded in between the second and third drawdowns!

Watch video below to help identify market trends:
Read more here:
https://acy.com/en/market-news/education/how-to-use-trendlines-trend-channels/
Conclusion
Prawin has been inactive for a while now though he allows other traders to copytrade his strategy.
He got 3 copiers at the moment.
You will see a copy button on his profile:

Congratulations to Prawin for achieving 543.72% returns despite the drawdown challenges he faced and bad trading decisions he made. Hope to see him back in trading action soon.
To learn more about Prawin and his trading statistics, you can visit his Tradingcup profile below:
https://www.tradingcup.com/signals/351670?server=7&login=351670
Are you a trader or a fund manager looking to provide or copy trading signals?
Visit Tradingcup now for more details.
Discover Profitable Signals
At Tradingcup, you can browse through a selection of signals and review past performance before you decide to copy.
Become A Signal Provider
Share your expertise and become a signal provider so other traders can copy your trades.
Stay tuned to our blog for more trader spotlights.
Trading involves risks.